Introduction
The page covers the 16th tutorial video.
Notes
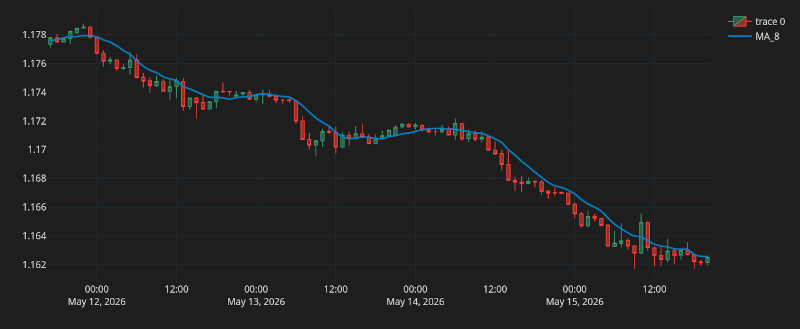
This video plots a moving average.
df_ma['MA_8'] = df_ma.mid_c.rolling(window=8).mean()
df_ma.dropna(inplace=True)
df_plot = df_ma.iloc[-100:].copy()
fig = go.Figure()
fig.add_trace(go.Candlestick(
    x=df_plot.time, open=df_plot.mid_o, high=df_plot.mid_h, low=df_plot.mid_l, close=df_plot.mid_c, line=dict(width=1), opacity=1,

))
fig.add_trace(go.Scatter(
    x=df_plot.time, y=df_plot.MA_8, line=dict(color="#027FC3", width=2), line_shape='spline', name='MA_8'
))
fig.update_layout(width=1000,height=400, margin=dict(l=10, r=10, b=10, t=10),
                  font=dict(size=12,color="#e1e1e1"),
                  paper_bgcolor="#1e1e1e", plot_bgcolor="#1e1e1e")
fig.update_xaxes(
    gridcolor="#1f292f", showgrid=True, fixedrange=True, rangeslider=dict(visible=False)
)
fig.update_yaxes(
    gridcolor="#1f292f", showgrid=True, fixedrange=True
)
fig.show()